User and Programmers Guide
Introduction
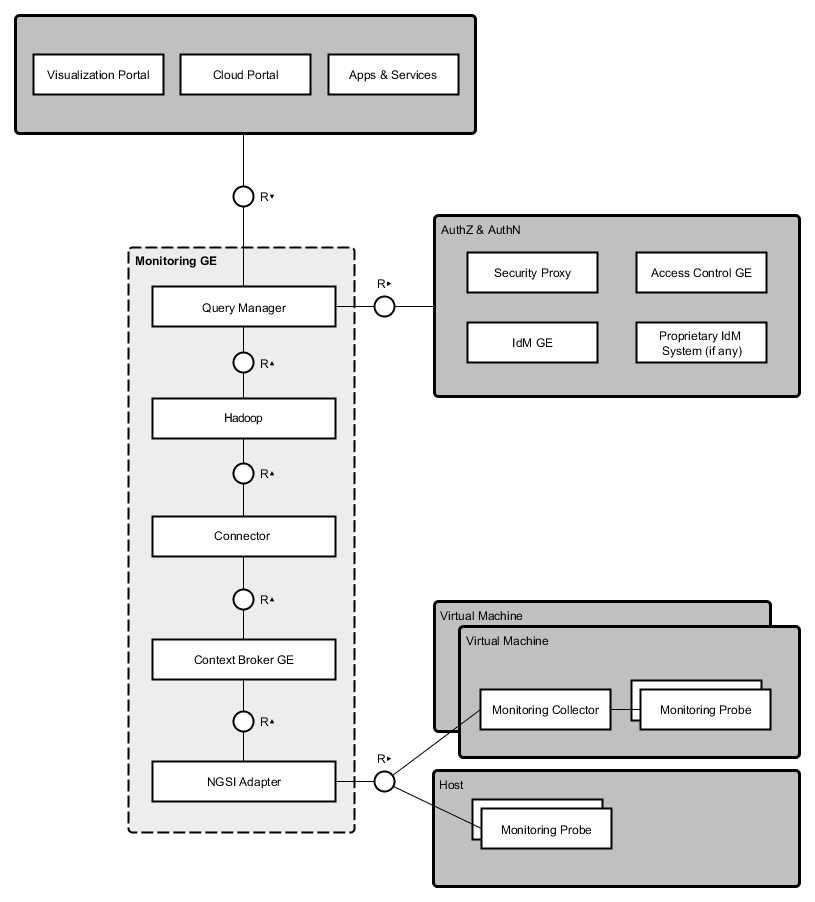
Welcome the User and Programmers Guide for the Monitoring Generic Enabler. This GE is built up from different distributed components, as depicted in the following figure:
Background and Detail
This User and Programmers Guide relates to the Scalability Manager GE which is part of the Cloud Hosting Chapter. Please find more information about this Generic Enabler in the following Open Specification.
User Guide
This GE does not provide an interactive user interface, hence there is no User Guide. The following section elaborates on programmatic usage.
Programmer Guide
According to the architecture aforementioned, there are several APIs involved in the monitoring process:
- NGSI Adapter API
- Context Broker API
- Monitoring (Query Manager) API
NGSI Adapter API
Probe raw data should be sent as body of a POST request to the adapter, identifying the source entity being monitored in the query parameters. For example, given the following scenario:
| Monitored host: | 178.23.5.23 |
|---|---|
| Monitoring tool: | |
| Nagios | |
| Monitoring probe name: | |
| check_load | |
| NGSI Adapter endpoint: | |
| http://adapterhost:1337 | |
then requests would look like:
HTTP POST http://adapterhost:1337/check_load?id=178.23.5.23&type=host
Content-Type: text/plain
OK - load average: 0.36, 0.25, 0.24|load1=0.360;1.000;1.000;0; load5=0.250;5.000;5.000;0; load15=0.240;15.000;15.000;0;
Please take into account that NGSI standard identify entities (in this case,
the resources being monitored) using a pair <entityId,entityType>. This
identification of the monitored resource has to be provided as the query
parameters id and type, respectively. The probe name included in
the URL lets NGSI Adapter know the originating monitoring probe, therefore
selecting the proper parser for it. This API is fully described in Apiary.
Monitoring framework is expected to schedule the execution of probes and send the raw data been gathered to the NGSI Adapter. Depending on the tool that has been chosen, this would require the development of a custom component (a kind of monitoring collector) to automatically forward such data to the adaptation layer.
NGSI Adapter parsers
NGSI Adapter processes requests asynchronously, trying to locate a valid parser
named after the originating probe, located at lib/parsers/. If probe is
unknown, response status will be 404; otherwise, response status will be
200, parser will be dynamically loaded, and then its parseRequest()
and getContextAttrs() methods will be invoked. With the attribute list
returned by the latter, Context Broker will be invoked.
Custom parsers for new probes may be easily added to NGSI Adapter, just extending a base abstract object and implementing the aforementioned methods. For example, suppose we want to support a new “myProbe” whose data is a comma-separated list of values of two attributes myAttr0 and myAttr1:
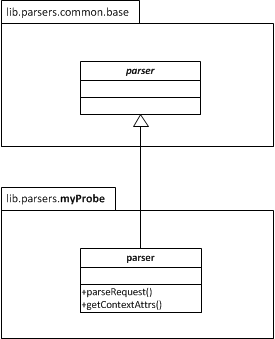
// module "lib.parsers.myProbe"

var baseParser = require('./common/base').parser,
    myParser   = Object.create(baseParser);

myParser.parseRequest = function(request) {
    return { data: request.body };
};

myParser.getContextAttrs = function(probeData) {
    var items = probeData.data.split(',');
    return { myAttr0: items[0], myAttr1: items[1] };
};

exports.parser = myParser;
Context Broker API
Please refer to Context Broker documentation. This will give us access to the last updates of monitoring data available, but not to historical data.
Monitoring API
Retrieval of historical data stored at a distributed filesystem (e.g. Hadoop) is handled by the Query Manager component, whose API is described in this preliminary specification.